

With the Tropos.io data stack radar, we keep track of several open-source projects and commercial tools. For each category, we would like to have multiple options to adapt the data stack to the customer’s use cases, scale, and budget. Before we add a solution to our tech radar, we assess it to ensure we can successfully scale and secure it in production with minimal risk. For this blog post, we’ll dive into Apache Superset. A popular open-source project for data visualization that’s actually competing with Tableau.
Technical Architecture
Since Apache Superset is already in production with many users, including at Airbnb, where the project started in 2016, the architecture is well throughout and scalable.
The web servers that serve the UI can scale entirely independently using a load balancer and scaling group or policy from the workers who execute the SQL queries. Using a configurable cache based on Redis, not all the queries triggered by the charts on the dashboards have to hit the (cloud) data warehouse.
It’s relatively easy to spin all this up using docker-compose or the helm chart. The documentation can be improved by a few examples of the reference architecture on Azure, AWS, or GCP with the metadata running on a managed database in Terraform or Pulumi. Oauth2 configuration documentation, often a requirement in large enterprises, is available.
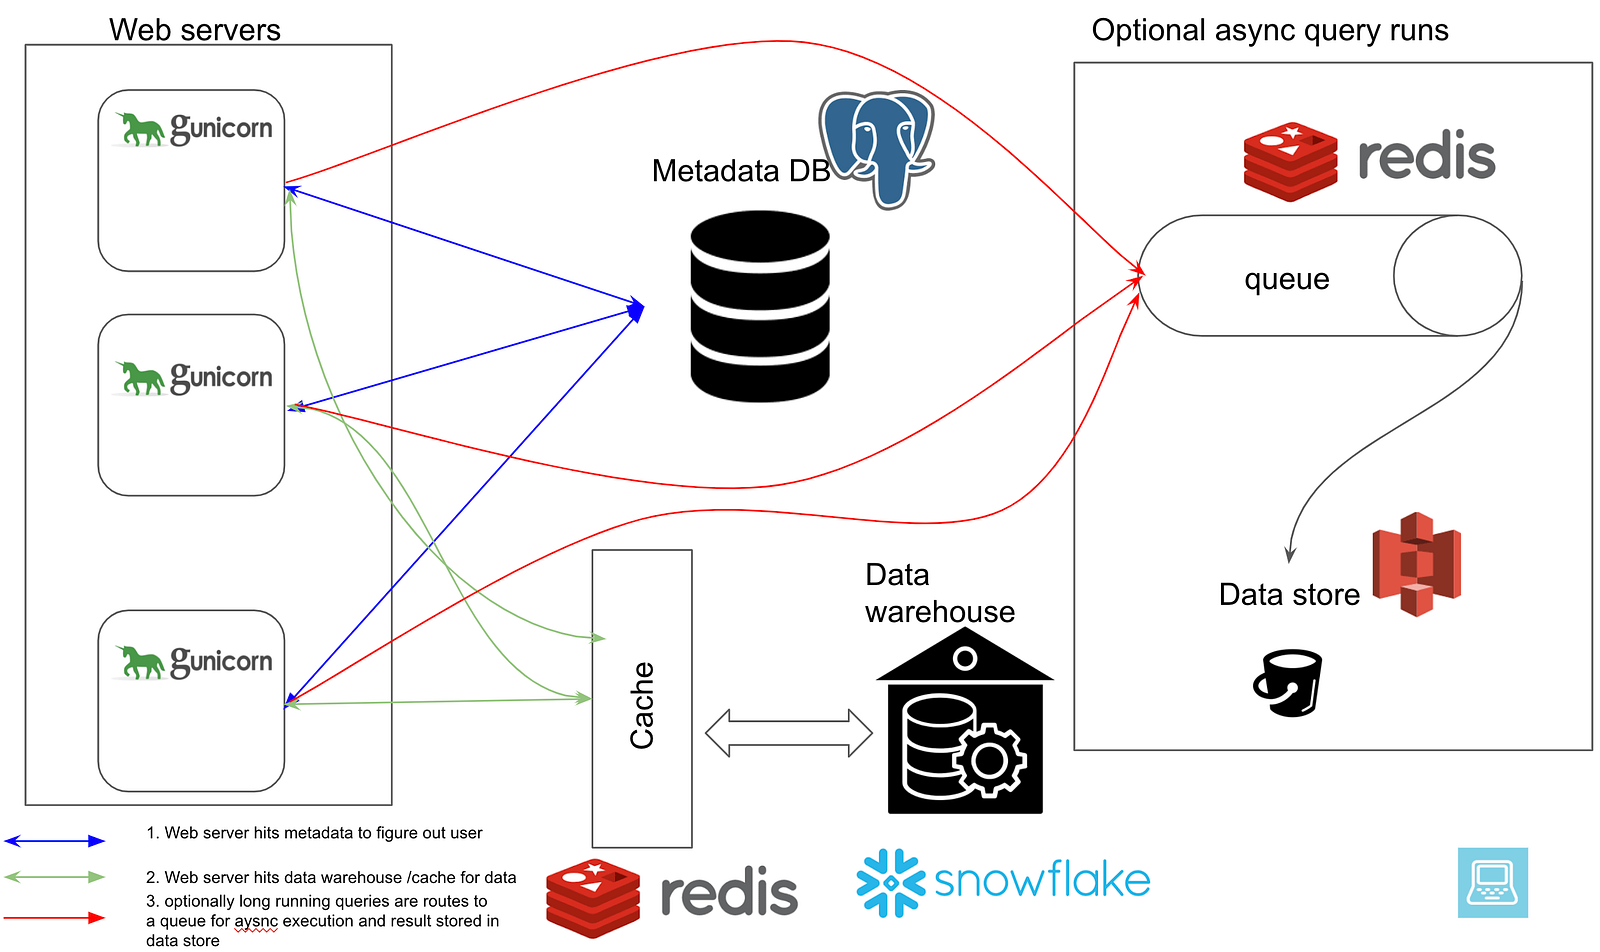
SQLAlchemy, the framework used by Superset to connect to the data sources, has battle-tested connectors to all major databases and cloud data warehouses.
From a Snowflake point of view, it’s possible to set a default warehouse and default role in the connection string.
We want the capability to authenticate with OAuth to leverage role-based security and data masking fully.
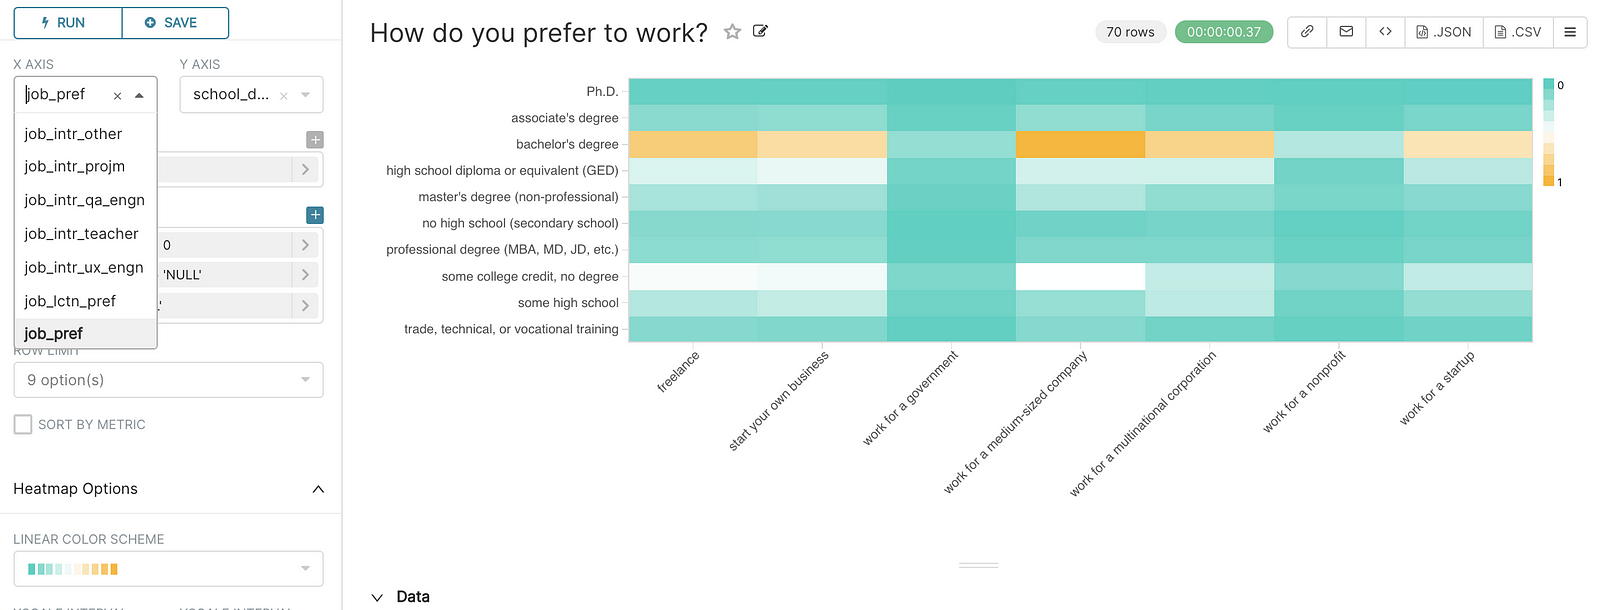
Apache Superset’s visualization capabilities
Since the move to Echarts, the number of great-looking chart types keeps expanding, and more tutorials on designing your charts appear online and in the Slack community.
From a GIS point of view, it’s a great deck.gl visualizations are included. You need to add MAPBOX_API_KEY = <your key> to your configuration file (config.py or superset_config.py).
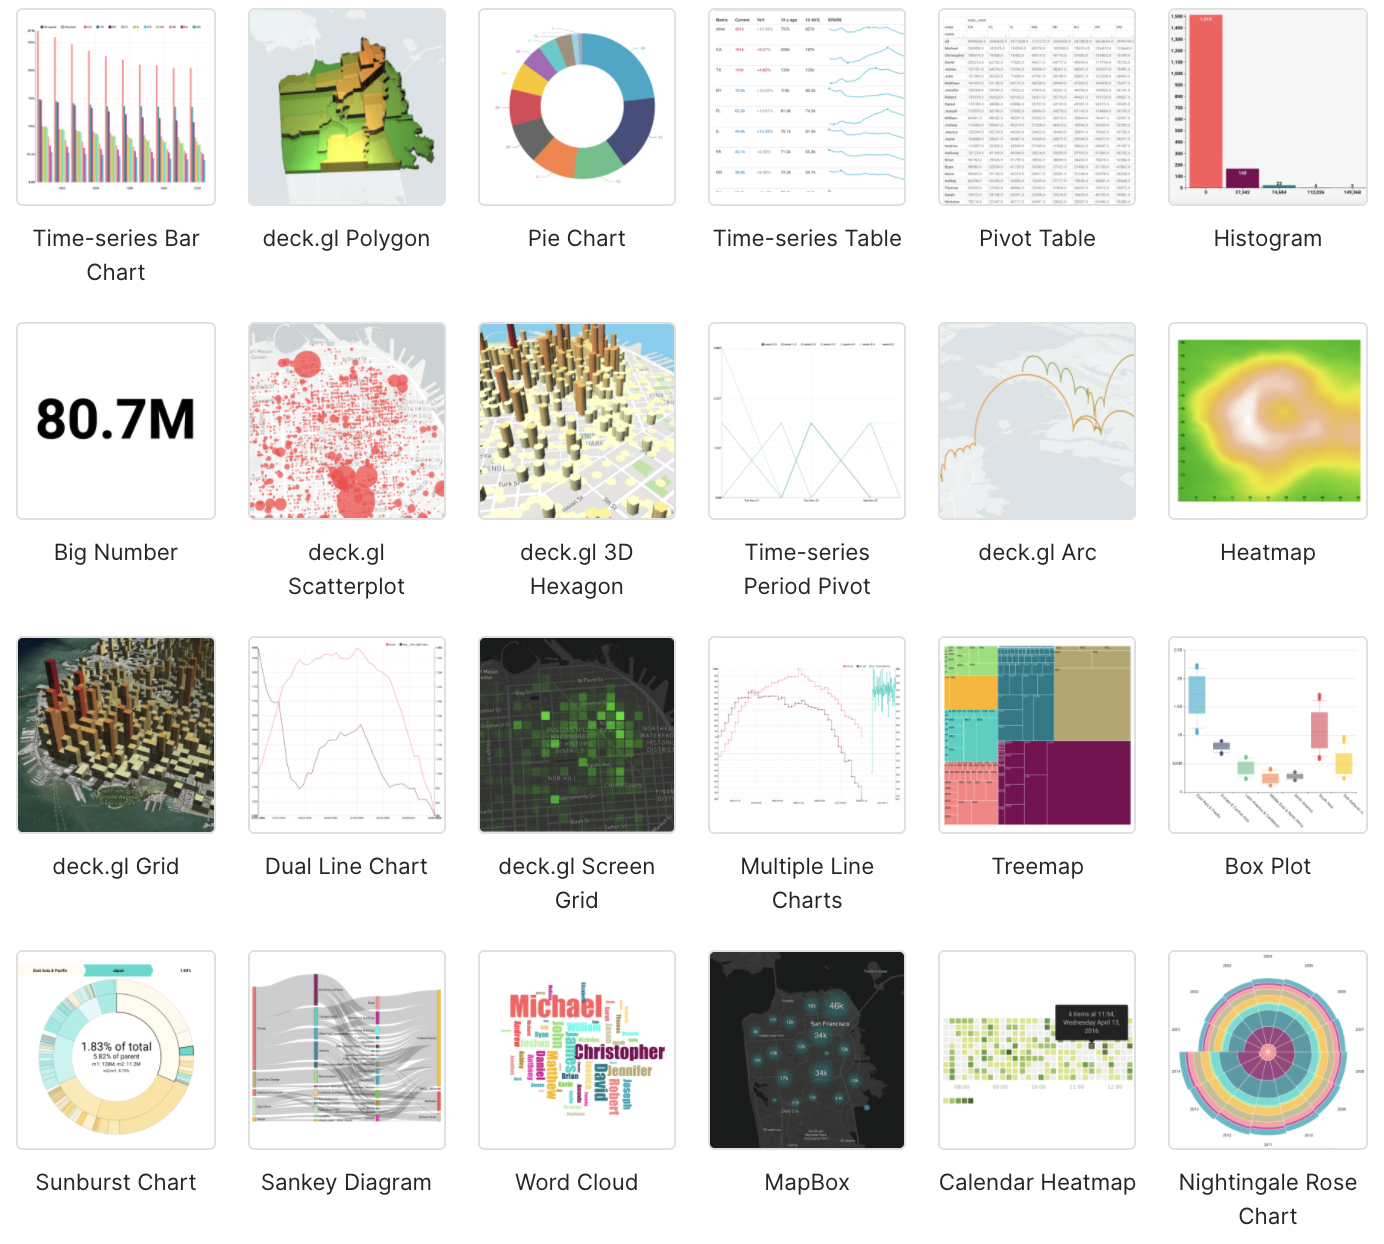
The UI is not yet drag-drop, but this is not a show stopper because the drop-downs are intuitive. For the most common chart types tweaking JSON is not necessary.
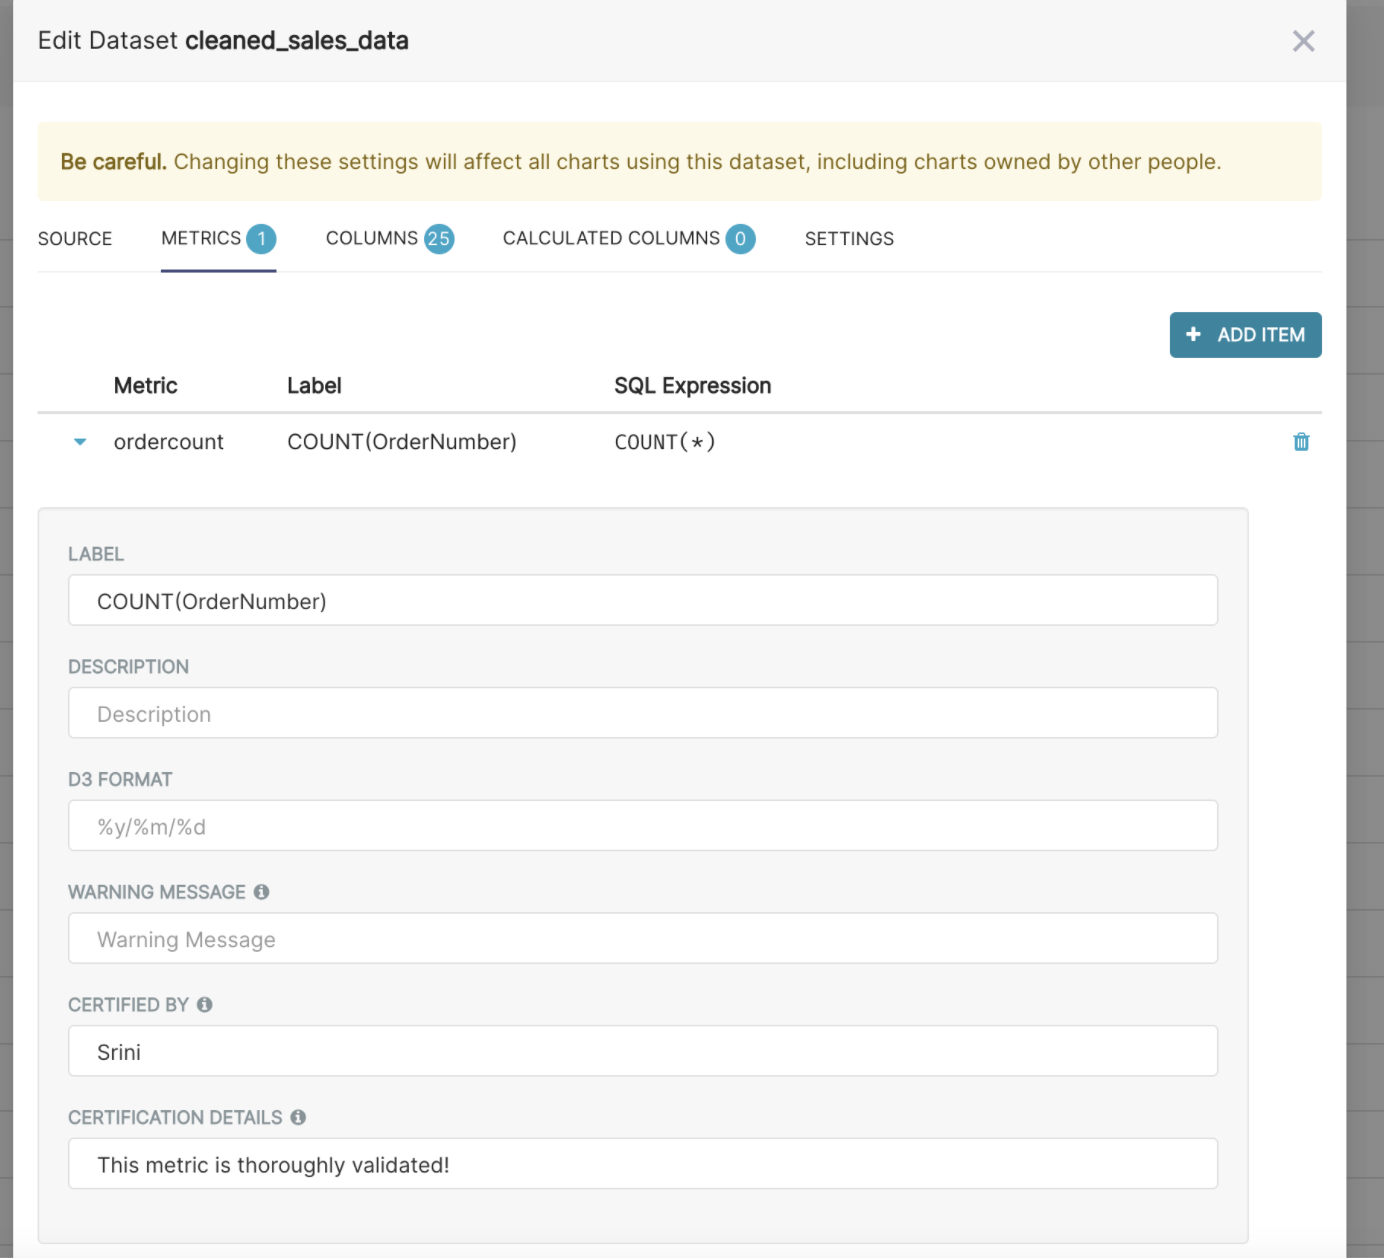
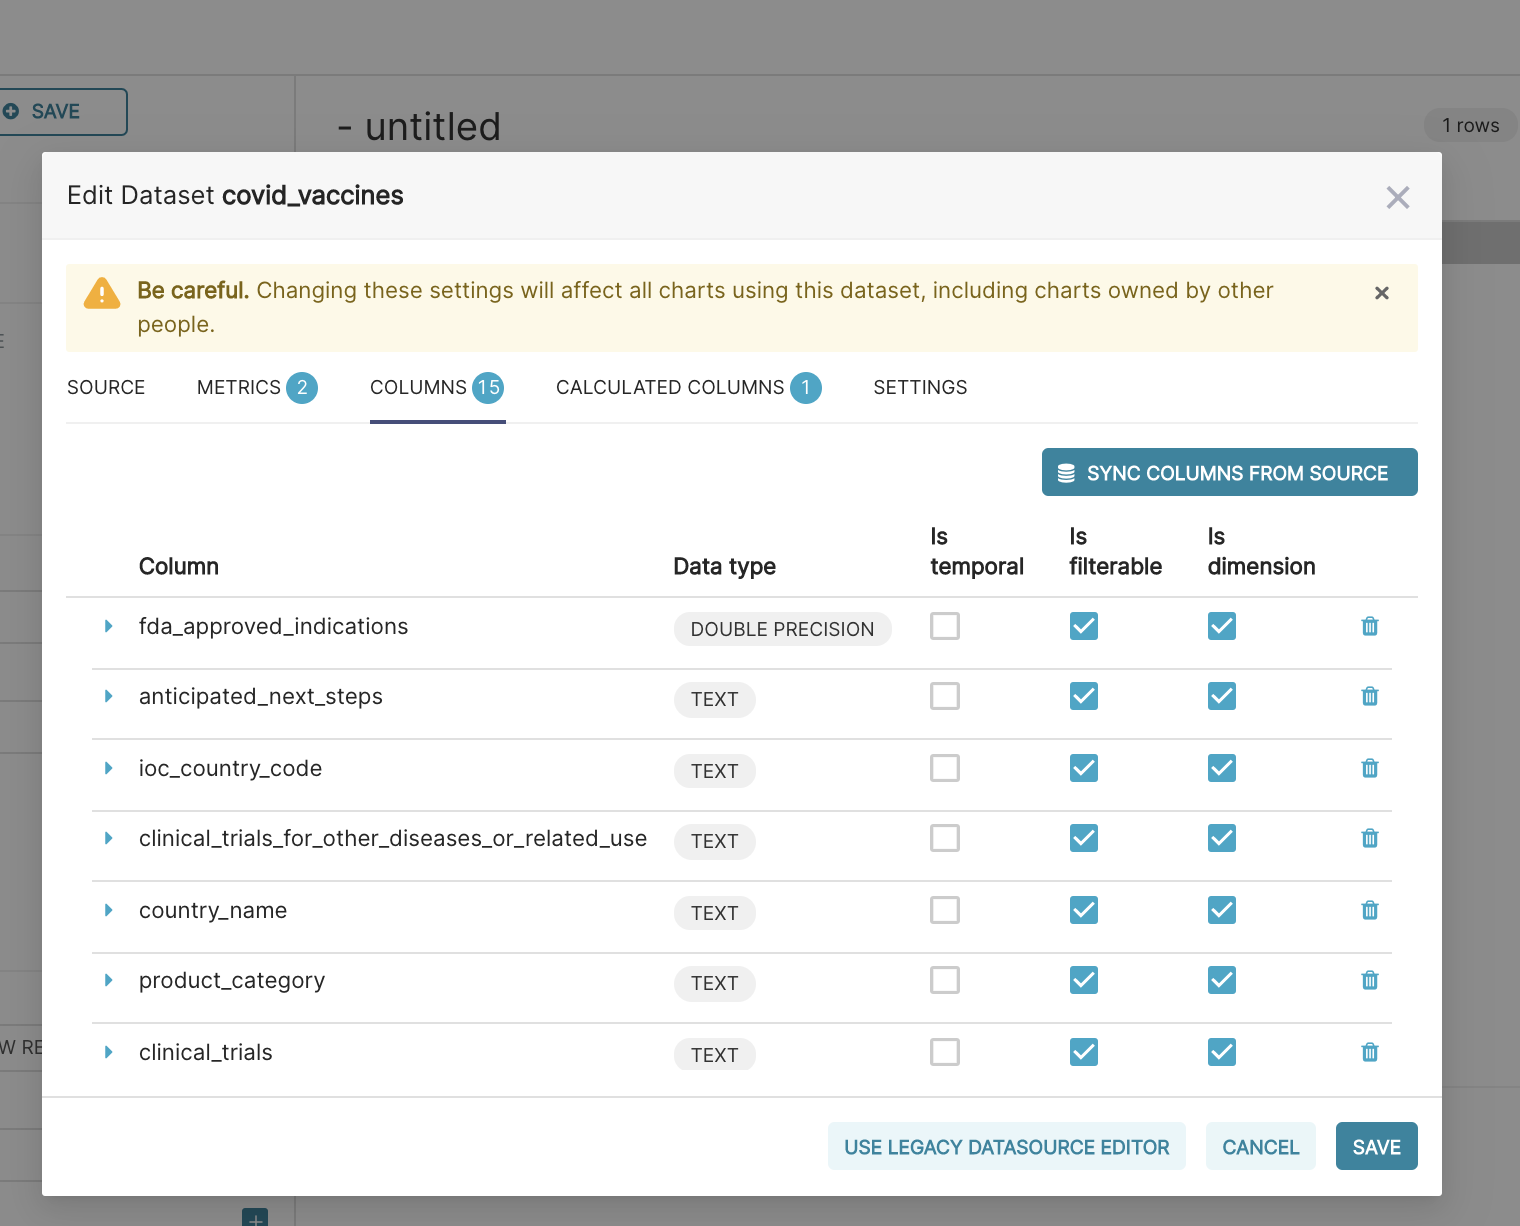
Data sources are transformed into “datasets” that act as a basic semantic layer, so it’s easy to add friendly field names, descriptions, calculated columns, and even some data governance-related fields.
Security
In several open-source data visualization frameworks, such as Plotly Dash, it’s feasible to create a great-looking dashboard, but configurable role-based access and row-based security are not available. These are features that are not that easy to develop from scratch.
Apache Superset supports these security features out of the box.
The names Gamma & Alpha of the default roles are a bit weird.
Users with role Alpha only have access to specific data sources and charts/dashboards based on these sources. These are dashboard viewers or readers. Gamma users are the dataset/chart/dashboard creators. They can only create new artifacts and edit the artifacts they own.
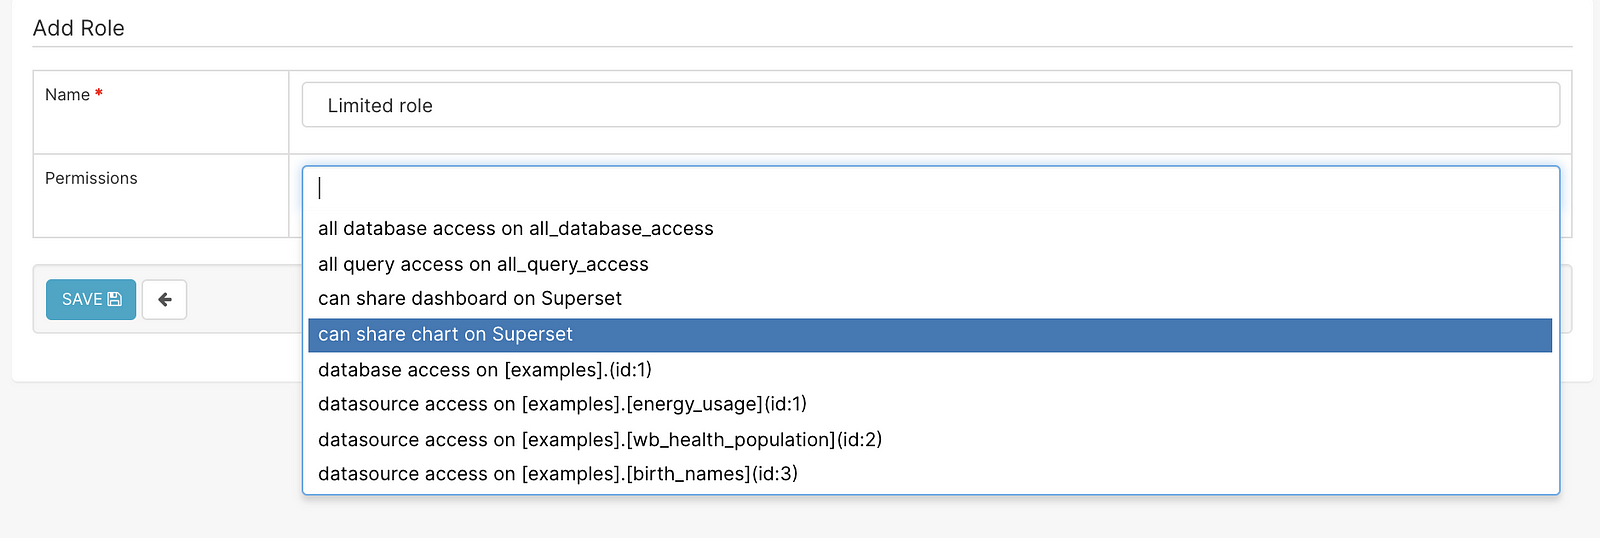
Let’s look into an example.
I’ve created a role to limit access to a specific data source.
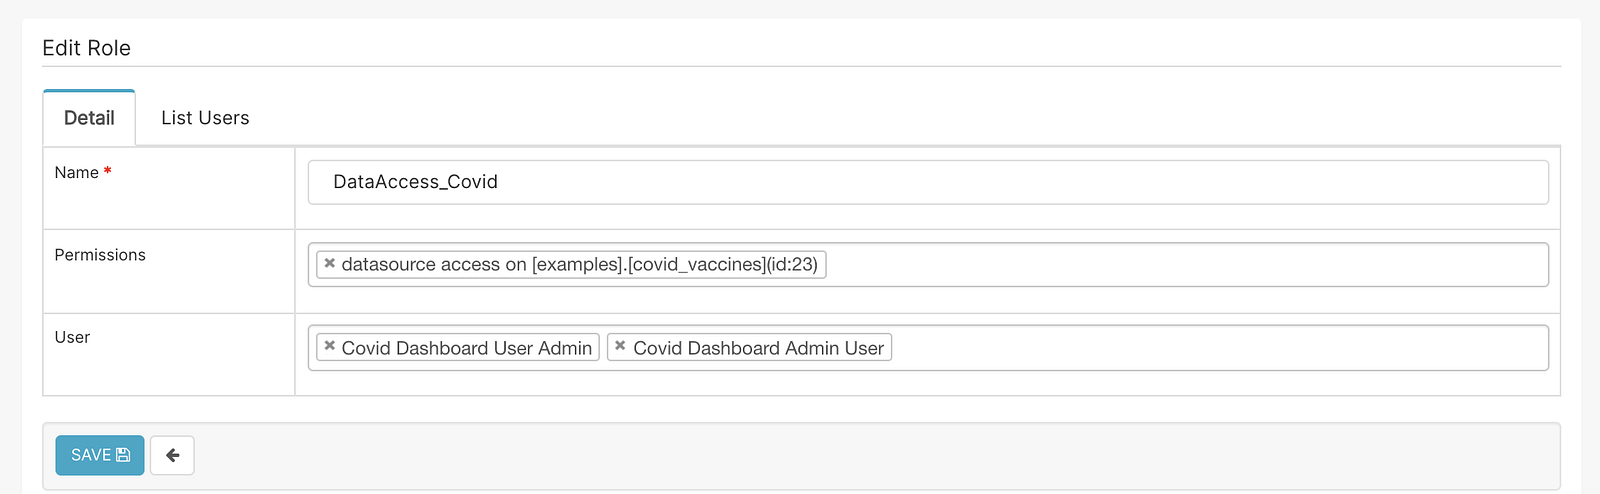
Then I’ve created a dashboard user and dashboard admin.
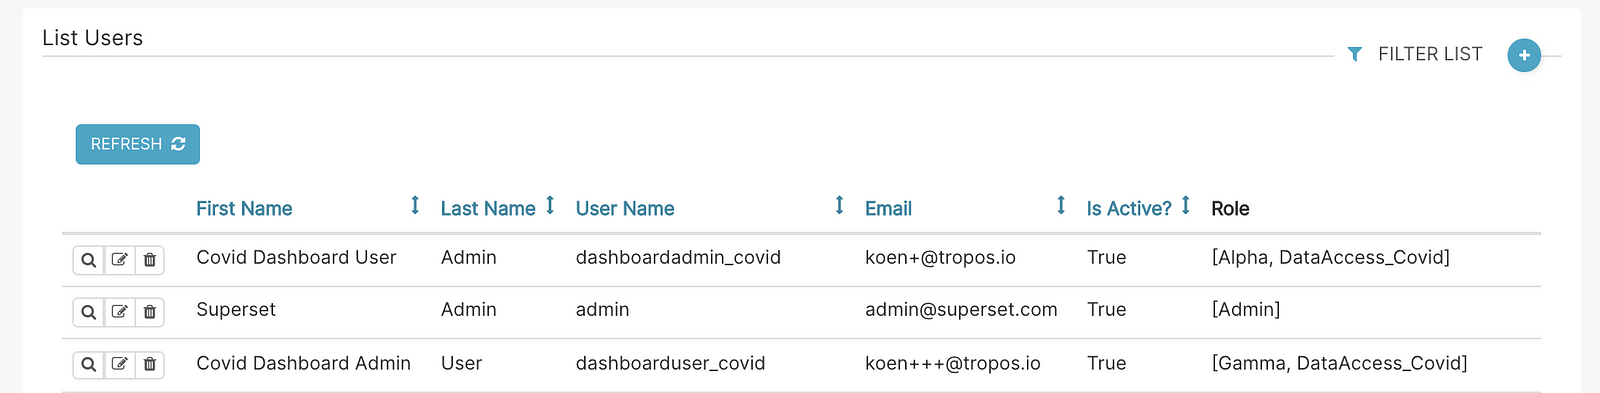
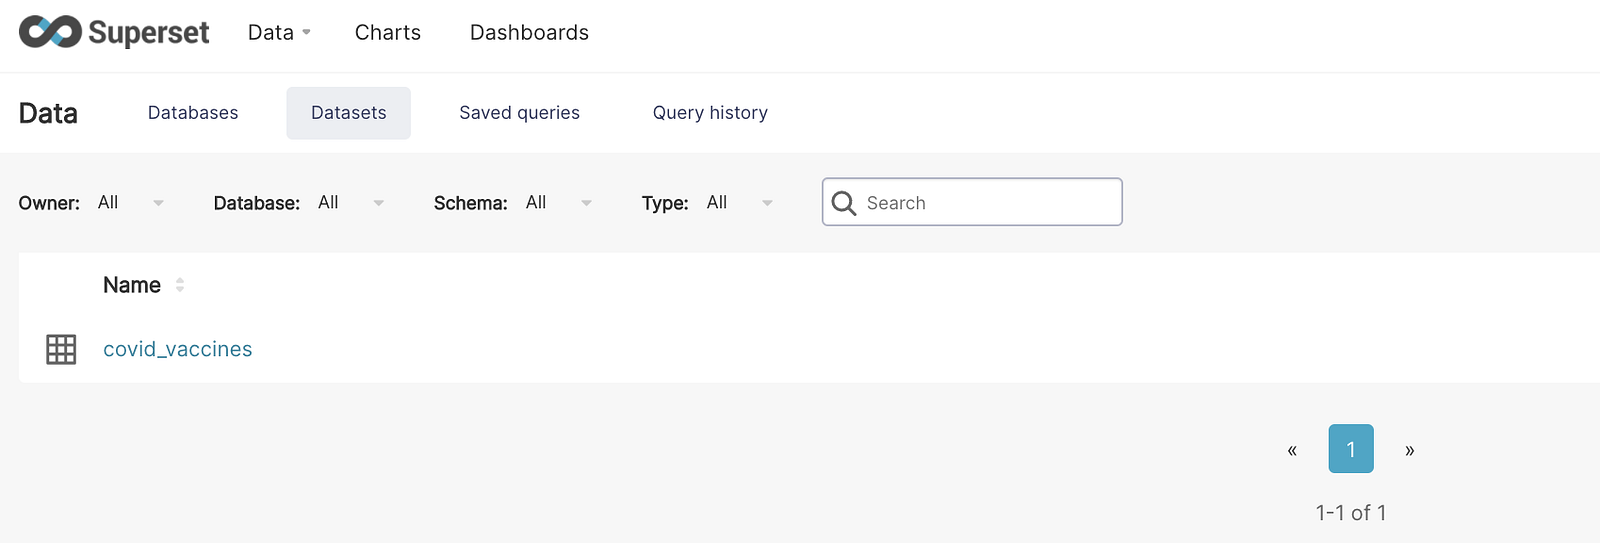
The dashboard user only has access to the covid dashboard and dataset.

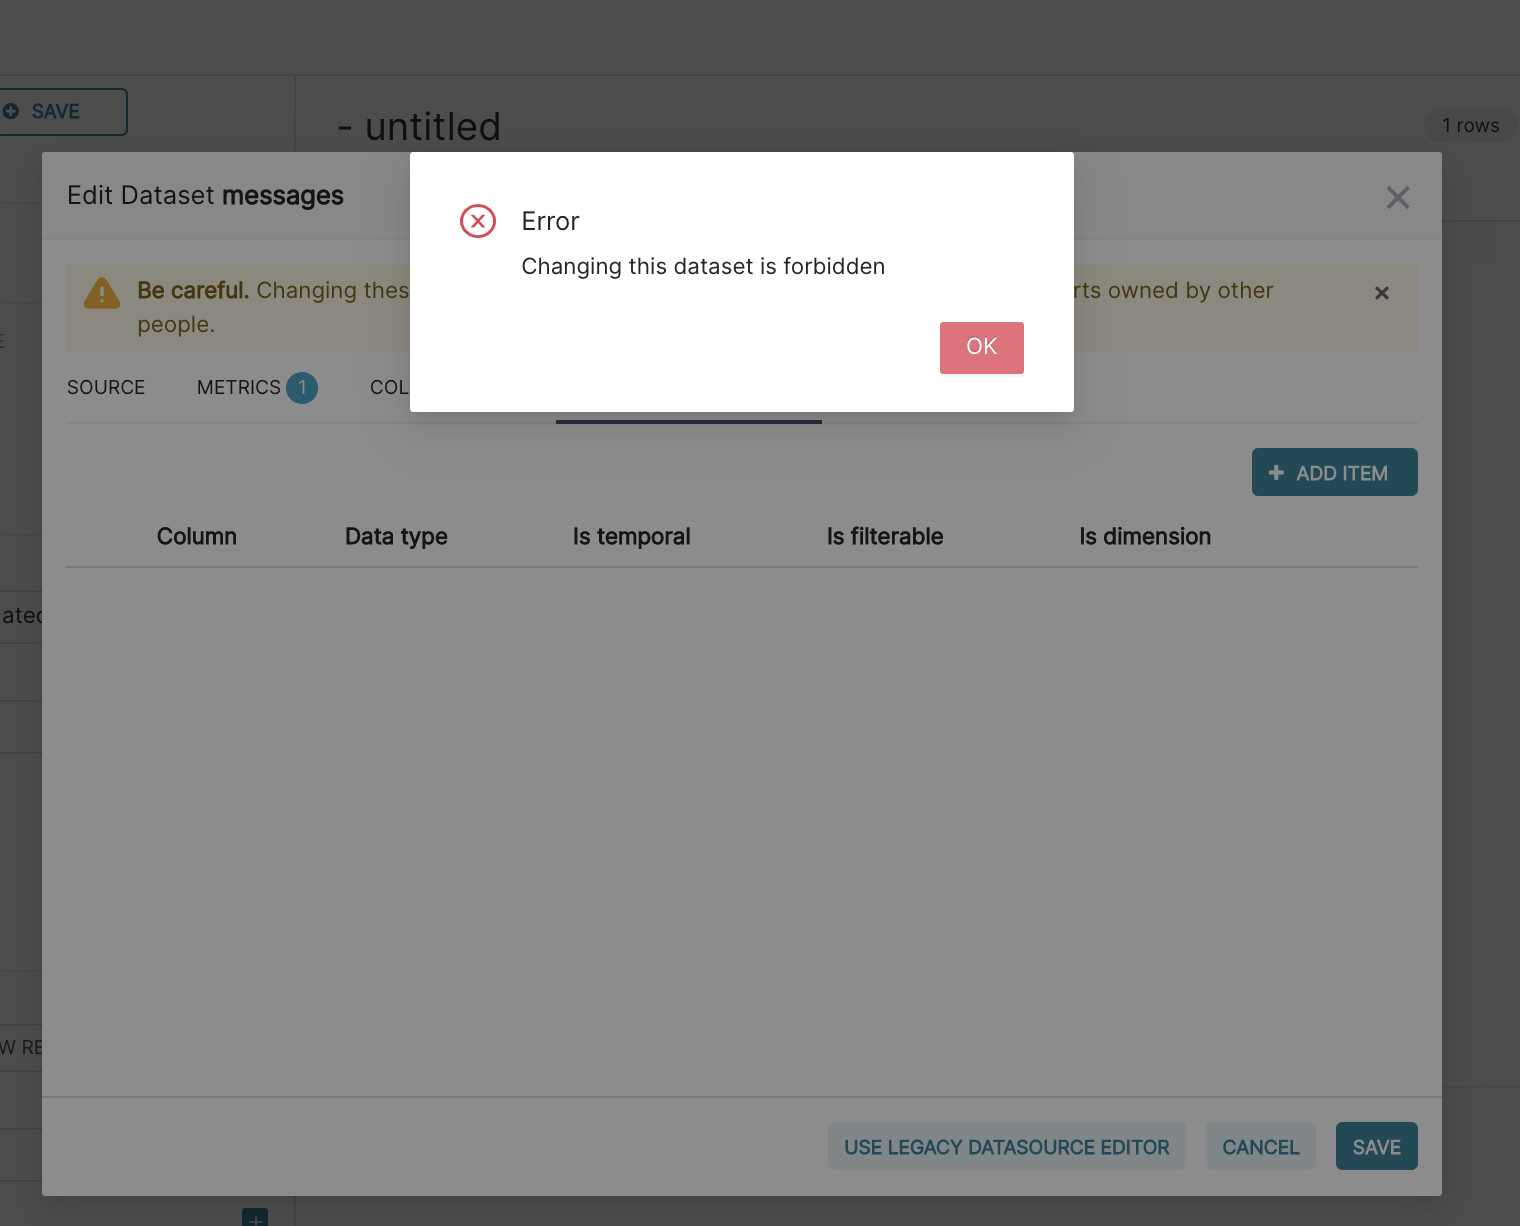
The admin user can edit the Covid dataset.
It’s not possible to edit other datasets.
Custom roles offer very fine-grained control over the functionality exposed to users and the API layer.
Row-level security is available, but you have to enable the feature in version <V1.2.0.
Apache Superset lacks several features available in commercial visualization tools such as folders and groups to organize datasets, charts, and dashboards. In projects with a manageable number of users, this is not a show-stopper, and the metadatabase is accessible, so a workaround is feasible.
Preset.io
As with other tools on our data stack radar, a fully managed service by the founders of the open-source projects will be available.
We’ve been in touch with Preset.io, and a fully managed Apache Superset with a free tier will be available publicly in the coming months.
We can’t confirm the pricing yet, but the estimate we got positions a preset.io user (with full access to all features) between the reader accounts and dashboard creator account pricing seen at several competitors 🙂
The launch pricing might be an issue for use-cases with a few dashboard creators and a large number of dashboard viewers. As with any SaaS solution negotiating a better customer-specific deal is an option.
SSO/Idp integration will be part of the entry-level tier, and we were amazed that it would be possible to spin up the service in European cloud locations on AWS/Azure/GCP. More advanced decks with other features such as AWS Private Link will be available. A migration path from and to the open-source version will be provided.
Next to a rename of the roles, preset.io adds the concept of separate workspaces to manage groups of users and dashboards.
Conclusion
We hope this blog post gives you a view of why we “upgraded” Apache Superset in our data stack radar. With this progress and the great community behind it, we are confident to use Apache Superset in several projects.
The free preset.io tier will be a valuable deployment option if you don’t want to regularly manually test, secure, and upgrade a self-managed Apache Superset.
So spin-up Apache Superset if you are looking for a cloud-native, customizable and user-friendly data visualization solution and get in touch if you need support.


